How to Use X (Twitter) Analytics: A Complete Guide to Your Performance Data in 2026
Learn how to use X (Twitter) Analytics in 2026. Navigate the dashboard, understand each metric, and turn your data into better content. Free and Premium options covered.

Key takeaways
- Free users can see per-post analytics on mobile. The full analytics dashboard requires X Premium ($8/mo or higher).
- Engagement rate matters more than impressions. 500 impressions with 5% engagement beats 50,000 impressions at 0.01%. X's algorithm rewards interaction, not eyeballs.
- The median engagement rate for brands on X is 0.029%, according to Rival IQ's 2024 benchmark report. Creators typically see 1.5–3% (Growth Terminal). Know which benchmark applies to you.
- X Analytics has blind spots. No competitor data, no click-through attribution, and audience demographics were removed in 2020. Budget for third-party tools.
- Data without action is decoration. Every metric in this guide includes a "what to do" so you can turn numbers into better content.
Most X creators check their follower count and call it analytics. That's like checking the final score without watching the game: you know the result, but you have no idea why it happened.
X Analytics shows you what's working and what isn't. Which topics get people talking, when your audience is actually online, whether your posts drive clicks or just scroll past. You don't always need a Premium subscription to see it, either.
This guide covers the dashboard screen by screen and breaks down what each metric actually means. Every section includes a "what to do" so you're not just staring at numbers.
What is X (Twitter) Analytics and who has access?
X Analytics is the platform's built-in performance dashboard. It tracks post performance (impressions, engagements, link clicks), account growth (followers, profile visits), and audience behavior over time. Whether you still call it Twitter analytics (or tweet analytics), it's the same tool, just rebranded. Functionally unchanged since 2023.
Access depends on your subscription tier. X Premium at $8/month unlocks the full analytics dashboard on desktop: 28-day overviews, exportable data, audience metrics. Premium+ ($40/month) adds everything in Premium. Basic ($3/month) offers limited analytics. Free users don't get the full dashboard, but they're not completely locked out. (For a full rundown of what each tier includes, see our X rate limits and feature reference.)
How to see X Analytics without X Premium
You can see basic X analytics without X Premium by tapping the bar chart icon on any of your posts in the mobile app. This shows impressions, engagements, detail expands, link clicks, and profile visits for that individual post. You won't get the 28-day overview or account-level trends, but post-level data is enough to start spotting what works.
On desktop, free users can click into individual post stats but can't access the dedicated analytics dashboard at analytics.twitter.com.
What to do: If you're testing whether analytics-driven posting is worth your time, start with the free mobile view for 2–3 weeks. Track your top 10 posts in a spreadsheet. If you see patterns worth acting on, Premium pays for itself.
| Feature | Free (No Premium) | X Premium ($8/mo+) |
|---|---|---|
| Individual post metrics | Yes (mobile app) | Yes (desktop + mobile) |
| Full analytics dashboard | No | Yes |
| 28-day performance overview | No | Yes |
| Data export (CSV) | No | Yes |
| Video analytics detail | Basic (view count) | Detailed (retention, completion) |
How to navigate the X Analytics dashboard (step by step)
The X analytics dashboard has two main views: your account overview and your individual content performance. Here's how to get around both. Consider this your X analytics dashboard guide for 2026.
- Open the dashboard. On desktop, go to analytics.twitter.com (the legacy URL still works) or click "More" in the left sidebar, then select "Analytics." You can also navigate to x.com/i/account_analytics directly. You'll need to be logged into an X Premium account.
- Check the date range. The dashboard defaults to a 28-day window. You can adjust this to see shorter or longer time periods.
- Start with the overview. This gives you the big picture: total impressions, engagements, follower changes, and profile visits for the selected period.
- Drill into individual posts. Switch to the content view to see how each post performed on its own.
Account overview: your 28-day snapshot
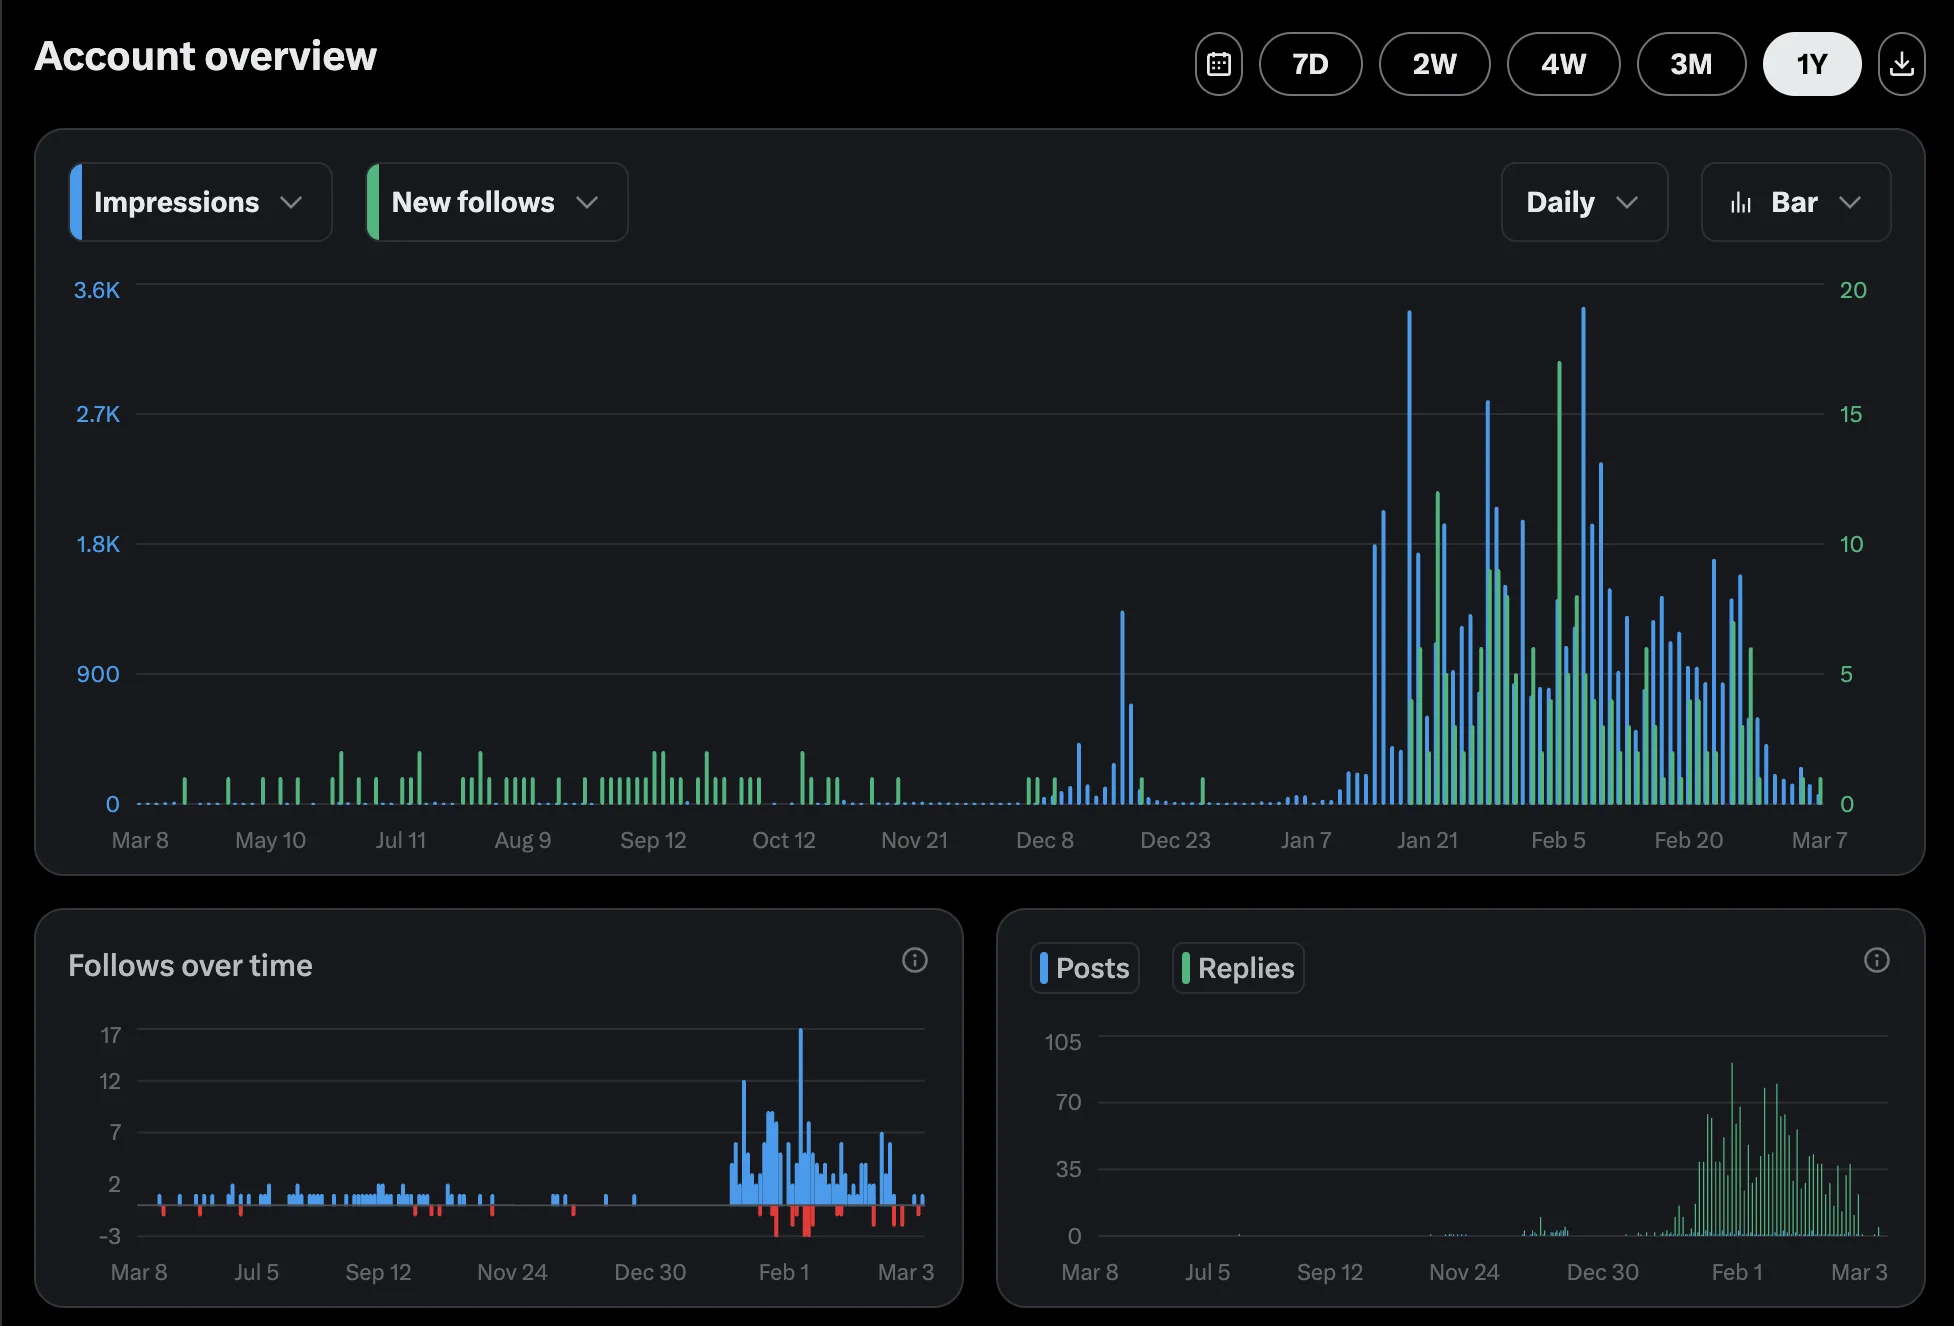
The account overview shows aggregate numbers across your selected time period: total impressions, total engagements, follower count changes, and profile visits.
This is where you spot trends. Impressions climbing while engagement stays flat? Your content is reaching more people but not connecting. A sudden spike in follower growth during a specific week? Something you posted that week is worth replicating.
What to do: Check the overview weekly, not daily. Daily fluctuations are noise. Weekly trends are signal.
The content tab: post-level performance
The content tab shows every post you've published, ranked by performance. Each row displays impressions, engagements, and engagement rate.
Sort by engagement rate, not impressions. A post with 800 impressions and 4% engagement tells you more about what works than a post with 20,000 impressions and 0.02% engagement. The first one means your audience cared. The second means the algorithm shoved it into feeds and people kept scrolling.
What to do: Every two weeks, identify your top 3 posts by engagement rate. Look for patterns: topic, format, time posted, length. Double down on the pattern, not the individual post.
What does each X Analytics metric actually mean?
Each metric measures a different type of audience behavior. Knowing what they track (and what they leave out) is how you go from staring at a dashboard to actually learning from it.
Impressions vs. engagement: why the difference matters
Impressions count how many times your post appeared on someone's screen. One person scrolling past your post in their feed equals one impression. This includes appearances in the For You feed, Following feed, and search results.
Engagements count deliberate actions: likes, reposts, replies, bookmarks, link clicks, profile visits from the post, detail expands, and media views. Impressions measure how far your post traveled. Engagements measure whether anyone actually cared.
A post with high impressions but low engagement means the algorithm pushed it out, but nobody stopped scrolling. A post with low impressions but high engagement means your existing audience loved it, but it didn't break into broader feeds.
What to do: If impressions are consistently low, your posting time or topic selection needs work. If impressions are high but engagement is low, your hooks and content format need attention.
How engagement rate is calculated (and what's a good number)
Engagement rate on X = total engagements (likes, reposts, replies, bookmarks, clicks) divided by total impressions, times 100.
A post with 50 engagements and 2,000 impressions has a 2.5% engagement rate. This single number tells you more about content quality than anything else in the dashboard because it normalizes for audience size. You can compare posts against each other regardless of how many followers you have.
What counts as "good" depends on who you are:
| Account type | Median engagement rate | Source |
|---|---|---|
| Brands (50K+ followers) | 0.029% | Rival IQ 2024 Social Media Benchmark Report |
| Creators (general) | 1.5–3% | Growth Terminal |
| Small accounts (under 5K followers) | Often 2–5%+ | Higher because of engaged niche audiences |
That brand median looks shockingly low. It is. Most brand accounts post promotional content to passive followers. If you're a creator or small business owner and your engagement rate is above 1%, you're outperforming most of the platform.
What to do: If your engagement rate is below the benchmarks for your account type, experiment with content format before blaming the algorithm. Threads, polls, and image posts tend to drive more interactions than plain text links.
The metrics most people ignore (detail expands, profile visits, bookmarks)
Three metrics hide in your post analytics that most people scroll past.

Detail expands track how many people clicked on your post to read the full thing. High detail expands mean your hook is working. People wanted to see more. If detail expands are high but likes are low, the payoff isn't matching the promise.
Profile visits from a specific post tell you whether your content made someone curious about you, not just the post. This is the strongest growth signal you have. A post that drives profile visits is doing more long-term work than a post that gets likes.
Bookmarks are the silent engagement. Someone bookmarking your post means they found it valuable enough to save but didn't want to publicly interact. High bookmarks relative to likes usually means you're putting out educational or reference-quality content. (Since likes became private in June 2024, bookmarks have become an even more important signal to watch.)
What to do: Track the ratio between detail expands and engagements. If people click in but don't engage, your content isn't delivering on the hook. If bookmarks are your highest engagement type, lean into educational content. That's what your audience values most.
Which X Analytics metrics matter most for your goals?
Not every metric matters equally for every account. A creator monetizing through sponsorships cares about different numbers than a local business driving foot traffic. Here's how to focus based on what you're actually trying to do.
For creators: engagement rate and follower growth
If you're building a personal brand or creator business, engagement rate is your primary metric. It determines how much the algorithm amplifies your content, and it's the number sponsors ask for first.
Follower growth rate matters too, but only in context. Gaining 500 followers after a viral post means nothing if your engagement rate drops the next week because those new followers aren't your target audience.
What to do: Track engagement rate weekly. If it holds steady or climbs as your follower count grows, your content-audience fit is strong. If engagement drops as followers rise, you're attracting the wrong people. Tighten your niche.
For small businesses: link clicks, profile visits, and conversions
Small business owners need metrics that connect to revenue. Impressions feel good but don't pay rent.
Link clicks measure how many people moved from X to your website, landing page, or product page. This is the closest X Analytics gets to measuring business impact.
Profile visits indicate brand curiosity. If someone visits your profile after seeing a post, they're evaluating whether to follow, click your link in bio, or check out your products.
X Analytics doesn't track conversions directly. That's one of its biggest gaps. You'll need UTM parameters on your links and Google Analytics (or similar) on your website to close the loop between a post and a sale.
What to do: Add UTM parameters to every link you post on X. Format: ?utm_source=x&utm_medium=social&utm_campaign=[campaign-name]. Then check your website analytics to see which posts actually drove purchases or signups.
How to use X Analytics data to improve your content
Reading your X metrics is step one. The value comes from using the data to test and improve systematically.
Here's a simple framework: every two weeks, review your top 5 posts by engagement rate. Tag each one by topic, format (text, image, thread, poll), posting time, and length. After a month, you'll have 10 tagged posts and the patterns become obvious.
We built a 3-week testing framework in our Best Time to Post on X guide that walks you through this process step by step. It uses your X Analytics data to test different posting times across three weeks and measure which performs best. The same framework works for testing content topics, formats, and hooks.
Don't optimize for a single viral post. Optimize for repeatable patterns. If image posts consistently get 2x the engagement rate of text posts in your niche, that's worth exploiting. If posts published between 8–10 AM get 40% more impressions, adjust your schedule.
Try this: block 30 minutes every other Friday to review your X post performance data. Identify one pattern. Test it for the next two weeks. Repeat.
What X Analytics doesn't tell you (and what to do about it)
No analytics tool is complete, and X's native dashboard has gaps worth knowing about before you run into them.
There's no competitor benchmarking. You can't see how your performance compares to similar accounts. Tools like Sprout Social or Socialinsider fill this gap, but they're paid.
Audience demographics are gone. X removed the Audience Insights tab in 2020 (confirmed by Sprout Social). No follower demographics like age, gender, location, or interests in the native dashboard anymore. Third-party tools and X's ad platform offer some of this data, but not for free.
The dashboard only shows a rolling 28-day window. Want to compare this quarter to last quarter? You'll need to export data regularly or use a third-party tool that stores historical data.
There's no relationship tracking. The dashboard shows how your posts performed, but not who you've stopped hearing from. For a complete system that tracks your engagement history with specific contacts and flags when relationships go quiet, check out our guide to tracking conversations on X. Or use tendX, the free Chrome extension that automates this for you.
X also can't tell you what happened after someone clicked your link. It counts the click, but for conversion tracking you need UTM parameters and website analytics.
And there's no hashtag performance tracking. You can't filter your analytics by hashtag to see which tags drove the most engagement. That's a manual tagging job or a third-party tool.
What to do: Accept these limitations instead of working around them with guesswork. For competitor data, pick 2–3 accounts in your niche and manually review their engagement patterns monthly. For demographics, run a poll or use X's ad campaign setup (you can see estimated audience data without launching an ad). For historical tracking, export your data as a CSV on the first of every month.
Start reading your numbers today
X Analytics has more useful data than most creators and small businesses realize. The dashboard isn't flashy, and some of the most valuable metrics are buried in post-level details. But it's all there, whether you use the full dashboard on Premium or the free per-post view on mobile.
We keep seeing the same thing: people who check their analytics regularly and actually change something based on the numbers, even small adjustments like shifting their posting time or leaning into a format that performs well, consistently outperform the people who post and hope.
Start simple. Pull up your analytics this week. Find your top 3 posts by engagement rate. What do they have in common? That's your first data point. Then use our Best Time to Post on X guide to run the 3-week testing framework and stop guessing about your schedule.